Case Study: Mobile App Marketing & Conversion Analysis
Table of Contents
📌 INTRODUCTION
How do user behavior and marketing touchpoints shape conversion rates in a mobile app for self-employed professionals in Germany?
This case study analyzes data from 29.1k users (15.1% conversion) between 2020 – 2025, with the goal of increasing subscription rates and acquisition efficiency.
I created 4 interactive dashboards in Looker Studio to uncover actionable insights:
- Overview – Growth, revenue & conversion trends
- User Behavior Analysis – In-app actions that drive conversion
- Marketing Performance – ROI by channel & campaign
- User Segmentation & Targeting – Region & profession-based targeting
🔧 Tools & Methods
- Data Preparation: Python ➡️ View Code
- Visualization: Looker Studio (Google Data Studio)
- Data: Internal app analytics (events, subscriptions, acquisition)
📊 Explore Dashboards 📊
1. Overview
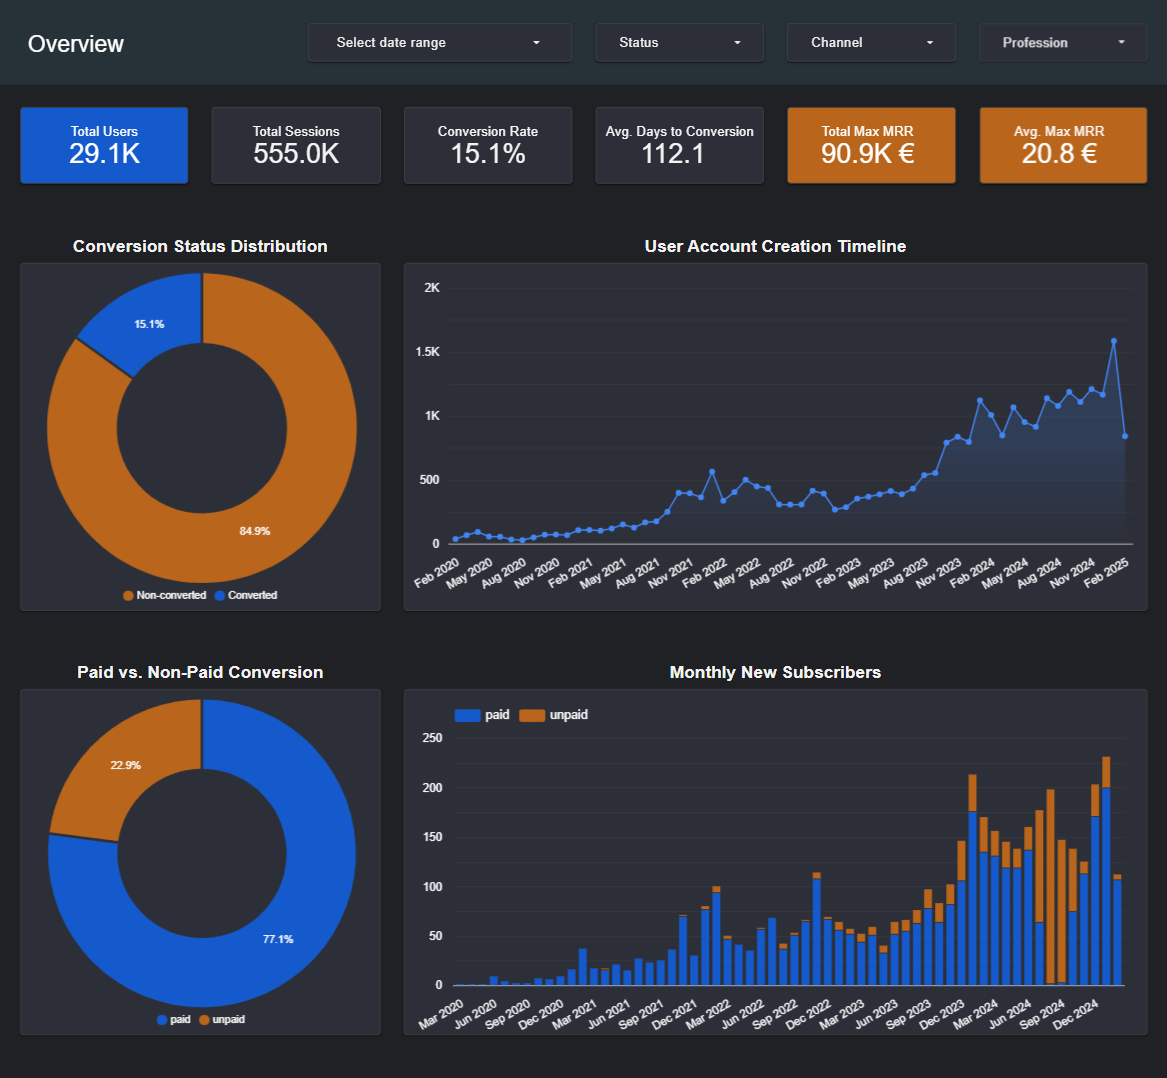
🎯 Goal: Provide a high-level snapshot of user growth, conversion trends, and subscription revenue over time.
📊 Key Visualizations
- KPI Cards: Total users (29.1k), Conversion Rate (15.1%), Total Monthly Recurring Revenue (MRR)
- Pie Charts: Conversion Status Breakdown (Subscribers vs. Non-subscibers), Paid vs. Non-paid Conversion (among Subscribers)
- Line Charts: Account Creation Timeline, Monthly New Subscribers
🔍 Insights
- Overall Conversion Rate opportunity: A 15.1% overall conversion rate indicates room for improvement.
- Strong user acquisition trend: The consistent growth in total users from 2020 to 2025 highlights successful brand building and increasing app popularity.
- Dominance of Paid Conversions: The “Paid vs. Non-paid Conversion” pie chart reveals that:
- Paid: Users who subscribed without using a free trial (77.1% of Converted users).
- Non-paid: Users who first tried the app with a free trial and then subscribed (22.9% of Converted users).
- Significant Spike in trial Conversions: The “Monthly New Subscribers” chart shows a notable increase in non-paid conversions during July – September 2024.
✅ Recommendations
Between July and September 2024, we noticed a spike in non-paid conversions that needs further investigation. Here are some important areas to consider:
-
Marketing campaign effectiveness: Marketing activity during this period should be reviewed in detail. Were any specific campaigns promoting free trials? Evaluate their performance by analyzing conversion rates and cost per acquisition (CPA).
-
Free trial promotions and onboarding: Check if there were any changes to the free trial, such as the trial duration, features, or onboarding process. It’s also important to analyze the churn rate among these new users to get a better sense of retention and long-term engagement.
-
Audience profile: Examine the demographics and usage patterns of the users who converted during this spike. Did they represent a specific region, segment, or behavioral profile? Investigate how actively they engaged with the product’s core features to determine alignment with key value propositions.
-
Were there any technical issues? Investigate whether any technical issues, such as bugs, billing errors, or outages. They may have affected the ability of users to complete paid sign-ups, perhaps leading to an increase in trial conversions as a fallback.
-
User reviews and feedback: Cross-reference our findings with with user reviews, support tickets, or app store feedback from the same period. This can provide additional context or highlight any recurring problems.
2. User Behavior Analysis
🎯 Goal: Identify high-converting in-app actions and behavioral patterns among different user types.
📊 Key Visualizations
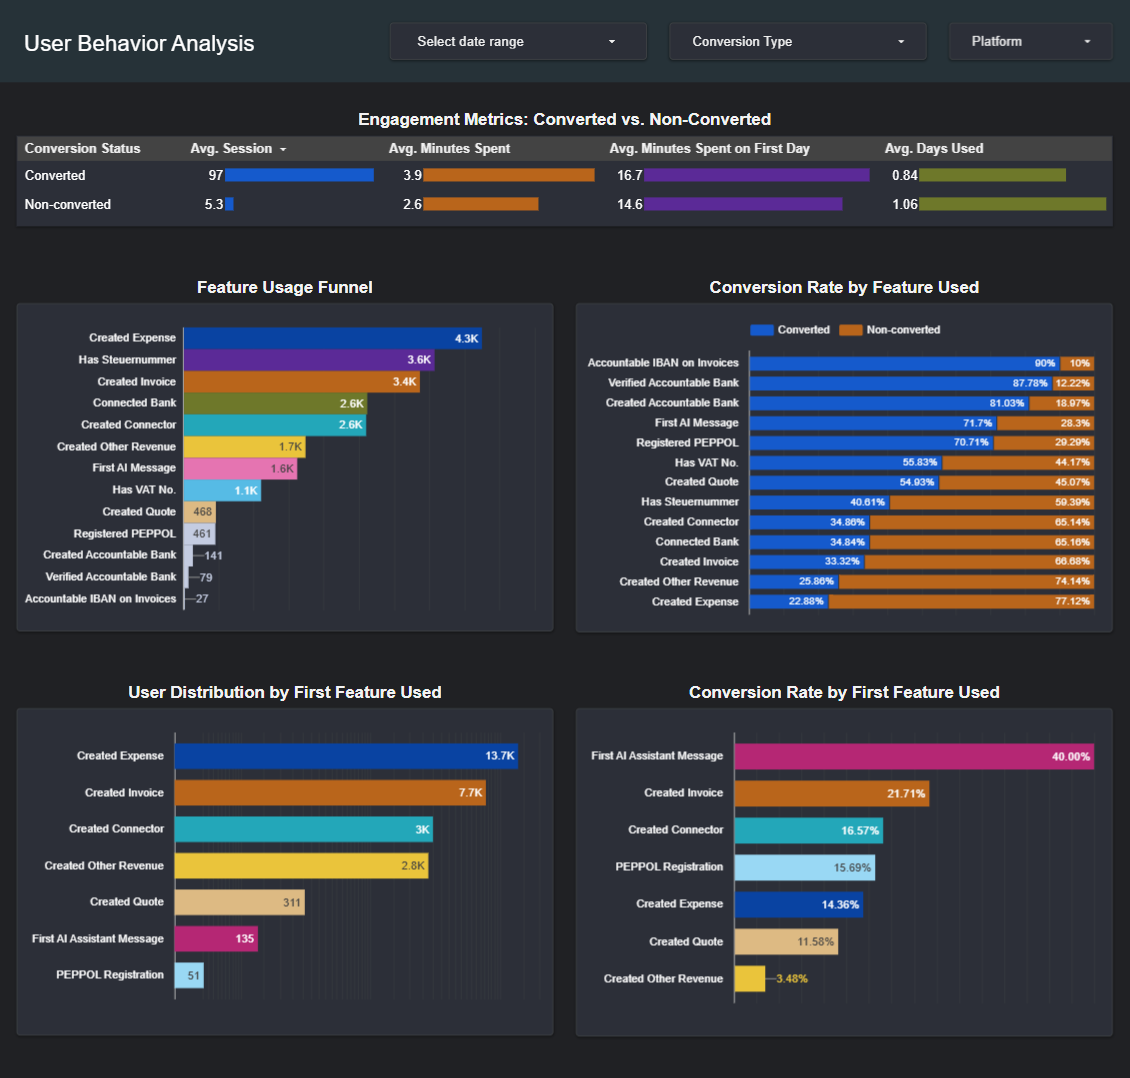
1. Engagement Metrics Table
- Converted users tend to have more sessions and spend more time per session, showing deeper engagement.
- Non-converted users use the app more frequently (with higher average days used) but spend less time overall, likely testing limited features (such as invoice creation or bank connections) that are restricted in the free plan.
2. Feature Usage Funnel
- Many users begin with basic features like Create Expense/Invoice or Enter Tax Number.
- Fewer users proceed to advanced tasks such as PEPPOL Registration, VAT Input, or IBAN Setup.
- These drop-offs may suggest:
- UX friction or complexity
- Lack of onboarding or tooltips
- Users are feeling overwhelmed with tax-related setup
3. Conversion Rate by Feature Used (100% Stacked Bar Chart)
- Although fewer users use features like IBAN Setup, Verified Bank, and PEPPOL Registration, those who do are far more likely to become paid users.
→ These actions suggest serious engagement and a high intent to fully use the platform. - AI Assistant has a moderate conversion rate (~71.7%).
- Frequently used basic features such as Create Expense, Invoice, or Other Revenue have lower conversion rates.
→ These are often used for quick testing by new or casual users without further exploration.
4. First Feature Used Distribution
Shows which feature users interacted with first after installing the app.
- Most users start with simpler actions such as Create Expense or Create Invoice.
- Fewer users begin with advanced or guided features, which mirrors the behavior seen in the usage funnel.
5. Conversion Rate by First Feature Used
Highlights how the first action impacts conversion likelihood.
- Users who start with AI Assistant have the highest conversion rate (40%), despite being a smaller group.
- Users who start with simpler features are less likely to explore further, resulting in lower conversion rates. → When users spend time exploring the app and engaging with its features, they are more likely to become paying customers.
🔍 Insights
- Early drop-offs in the usage funnel suggest onboarding friction.
- Users who adopt financial tools or AI early are more likely to convert.
- Conversion is influenced not only by feature use, but by the order and timing of use.
✅ Recommendations
Onboarding Improvements
- Add tooltips and onboarding prompts for advanced features.
- After completing a simple task, guide users to the next useful step. For example, if they create an invoice, suggest they connect their bank account.
AI Assistant Optimization
- Introduce a required (but skippable) first interaction with the AI Assistant.
- Use the Assistant to walk users through the onboarding process (e.g., suggesting VAT input after tax number entry).
Incentives and Retention
- Offer a 14-day trial to users who connect a bank but do not convert.
- Use tailored in-app nudges to re-engage consumers who have dropped out early in the funnel.
3. Marketing Performance
🎯 Goal: Evaluate marketing channels by conversion, spend, and ROI to optimize acquisition strategy.
📊 Key Visualizations
1. Conversion Speed Breakdown
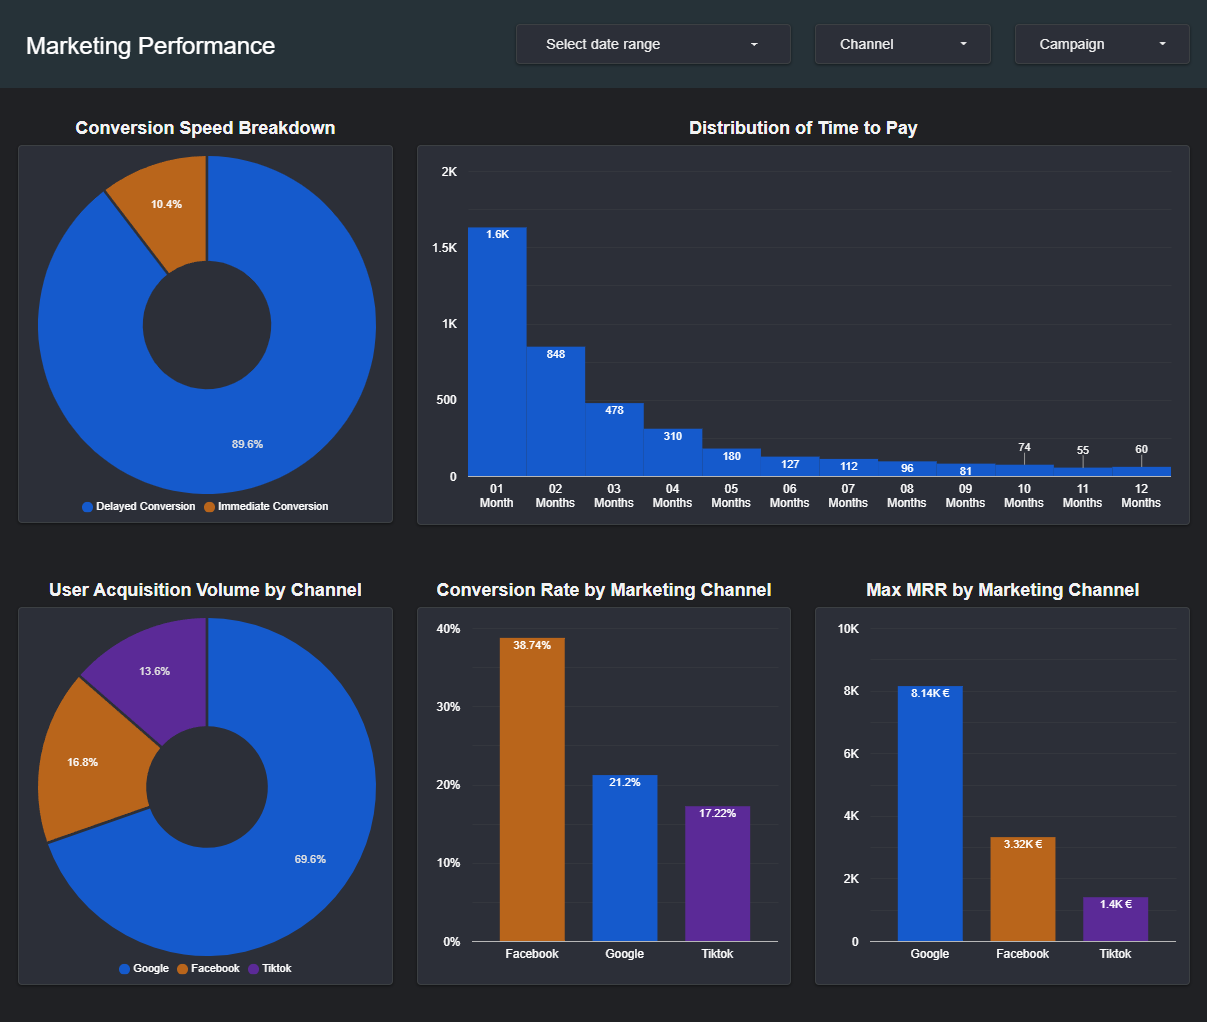
Among converted users, 10.4% converted immediately — meaning they subscribed on the first or second day of using the app.
2. Time to Pay Distribution
Most users convert within the first 1–2 months.
3–5. Marketing Channel Performance
Evaluation by user volume, conversion rate, and maximum MRR:
- Google brings in the largest volume of users, top MRR, but moderate conversion.
- Facebook achieves the highest conversion rate, surpassing Google and TikTok, despite having moderate user traffic and MRR.
- TikTok exhibits the lowest performance across user volume, conversion rate, and MRR, indicating overall underperformance.
6–7. Campaign Performance
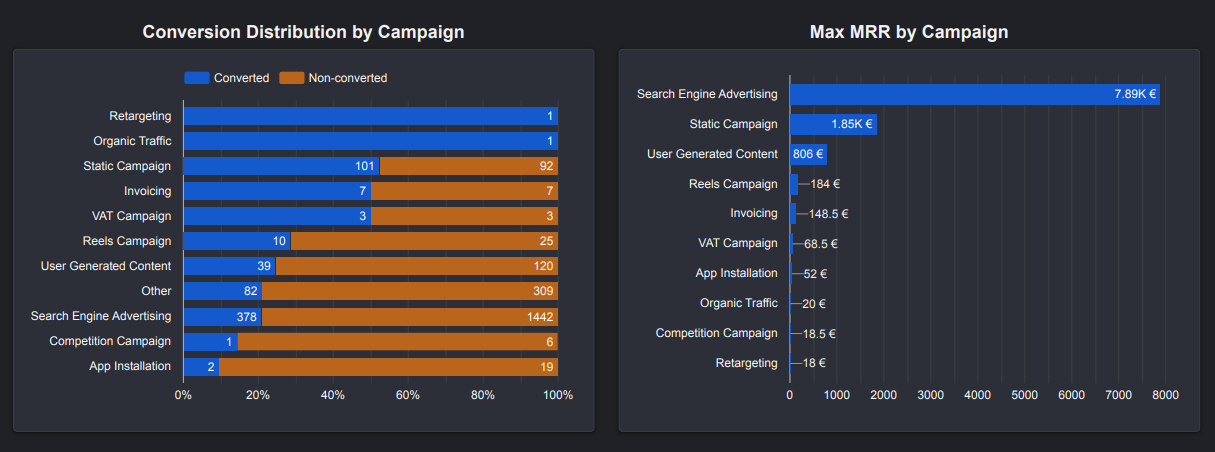
Analysis by conversion distribution and Max MRR.
⚠️ To ensure data accuracy for the campaign analysis, we’ll need to perform a data cleaning step. The original
campaigncolumn presented inconsistencies in naming, which were resolved by grouping similar entries into these standardized categories:
sea→ Search Engine Advertisingugc→ User Generated Contentvat→ VAT Campaign
- Two campaigns (“Retargeting” and “Organic”) show 100% conversion, but each had only one user, so they’re not statistically meaningful.
- Google’s Search Engine Advertising brings the highest Max MRR, despite a lower conversion rate.
- The Static Campaign ranks second in Max MRR and has a high conversion rate of 52.3%.
8–9. Promocode Analysis

- Promocode usage significantly boosts both conversion rate and conversion speed.
🔍 Insights
- Social media (e.g., Facebook): Brings in a lot of paying customers and generate significant revenue. This tells that our audience on these channels is highly engaged. Hence, we should consider making further investments and scaling successful creatives.
- Search engine (Google): Despite having the largest user volume and MRR, search engine campaigns has a moderate conversion rate, which shows potential for improvement through better keyword targeting and landing page relevance.
- Short-form video (TikTok): This channel is currently underperforming across key metrics. It’s not bringing in many users, conversions, or revenue. This might be because the typical TikTok user isn’t a good match for our target audience. Therefore, before making any further investments, we should test the channel with a smaller, well-targeted experiment.
✅ Recommendations
Channel Strategy:
- Facebook: Given its strong conversion rates, consider increasing the budget to maximize returns.
- Google: Focus on top-performing search campaigns by refining keyword targeting and enhancing the relevance of ads and landing pages to boost conversion rates.
- TikTok: Before deciding on budget reductions, run a targeted experiment aimed at users aged 25-35 interested in business, finance, and freelancing.
Campaign Tactics:
- Prioritize High ROI: Allocate more budget to campaigns with a high return (e.g., SEA, Static).
- Explore High-Potential: Monitor and test scaling campaigns with high conversion rates but low volume (e.g., Retargeting, Organic).
- Drive Faster Conversion: Use limited-time promotions to encourage quicker subscriptions.
4. User Segmentation & Targeting
🎯 Goal: Segment users by behavior, profession, and region to personalize marketing and onboarding.
a. Regional Segmentation
-
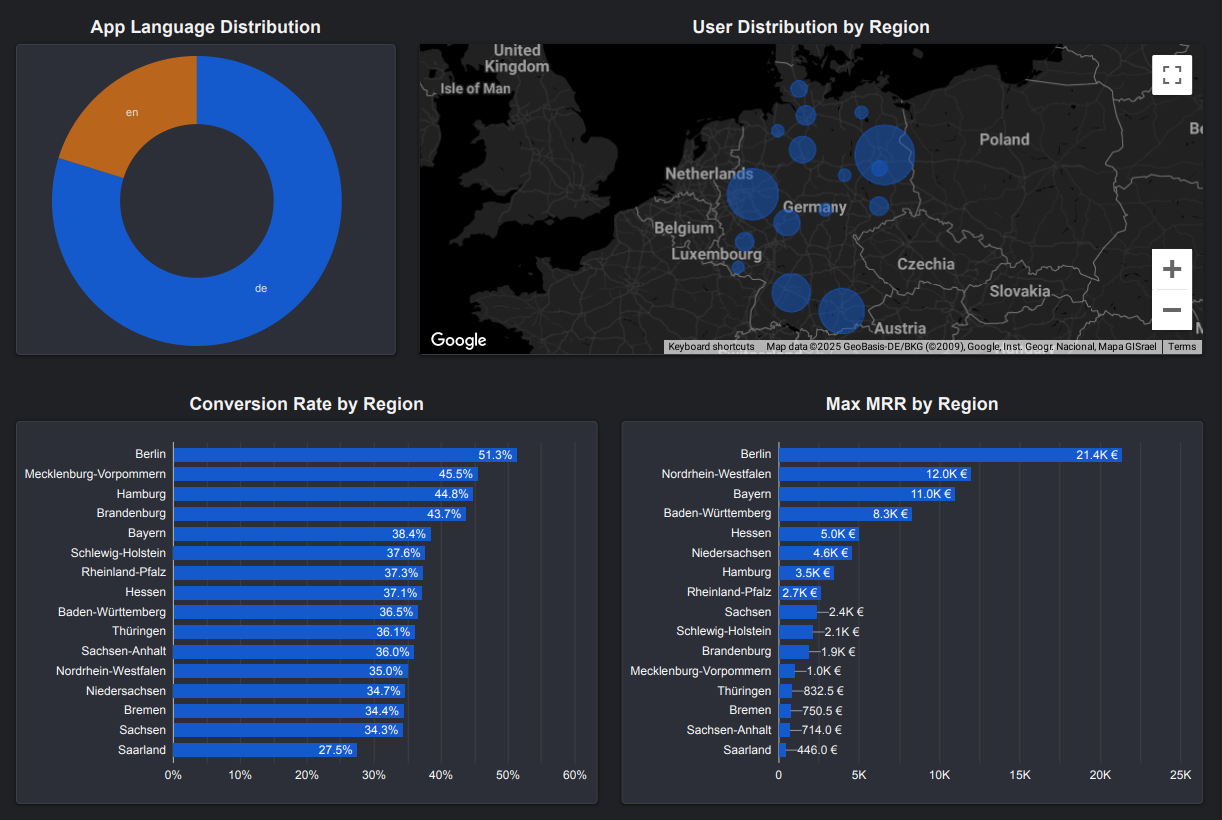
Berlin stands out as the region with the largest user base, the highest conversion rate, and the highest Max MRR.
➡️ Significantly increase marketing budget for Berlin to capitalize on high-performing market.
➡️ Analyze top-performing campaigns within Berlin to identify successful strategies that can be adapted and scaled to other promising regions. -
Nordrhein-Westfalen & Bayern demonstrate strong potential with high Max MRR and robust conversion rates.
➡️ Maintain or slightly increase marketing investment in these regions.
➡️ Conduct A/B testing on new and innovative campaign ideas to improve performance, increase user acquisition, and boost revenue. -
Mecklenburg-Vorpommern & Hamburg has fewer users, but strong conversion efficiency.
➡️ Boost user acquisition by implementing targeted, low-cost awareness campaigns. Even small investments can lead to strong results. -
Saarland shows low user acquisition, poor conversion rates, and low revenue generation.
➡️ Conduct in-depth market research within Saarland to determine low performance and potential barriers to adoption.
➡️ Based on the research findings, explore cutting back ad spend in this region or shift to highly targeted, experimental campaigns if there’s a promising opportunity for improvement.
b. Users by Self-Employment Status
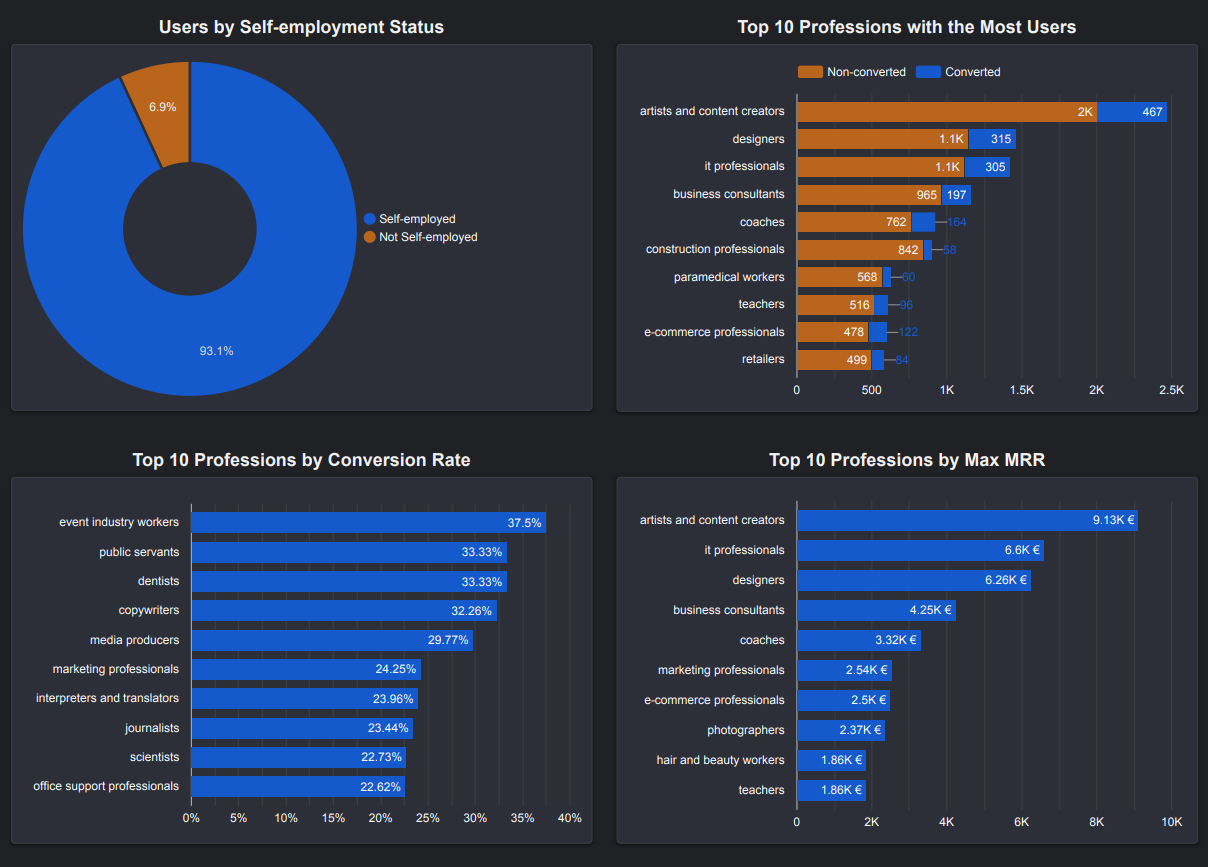
- The majority identify as self-employed, indicating strong alignment with the app’s intended target audience.
- A smaller segment includes people who are not currently self-employed, potentially representing:
- Users exploring the app out of general interest.
- People who are getting ready to start their own businesses.
- A potential secondary market that could be further explored.
➡️ Continue prioritizing marketing and feature development for the core self-employed user base.
➡️ Consider developing introductory or informational content tailored to the “pre-freelancer” segment to nurture potential future users.
c. Profession-Based Segmentation
- Artists & Content Creators are the largest group and generate the highest Max MRR (due to size). However, their conversion rate is not the highest among all professions, showing room for improvement. The high MRR is primarily driven by the sheer volume of users in this category.
- Discrepancy between volume and conversion: Notably, the professions with the highest number of users do not always have the highest conversion rates. This highlights the need for a refined approach to targeting.
d. VAT Type Segmentation
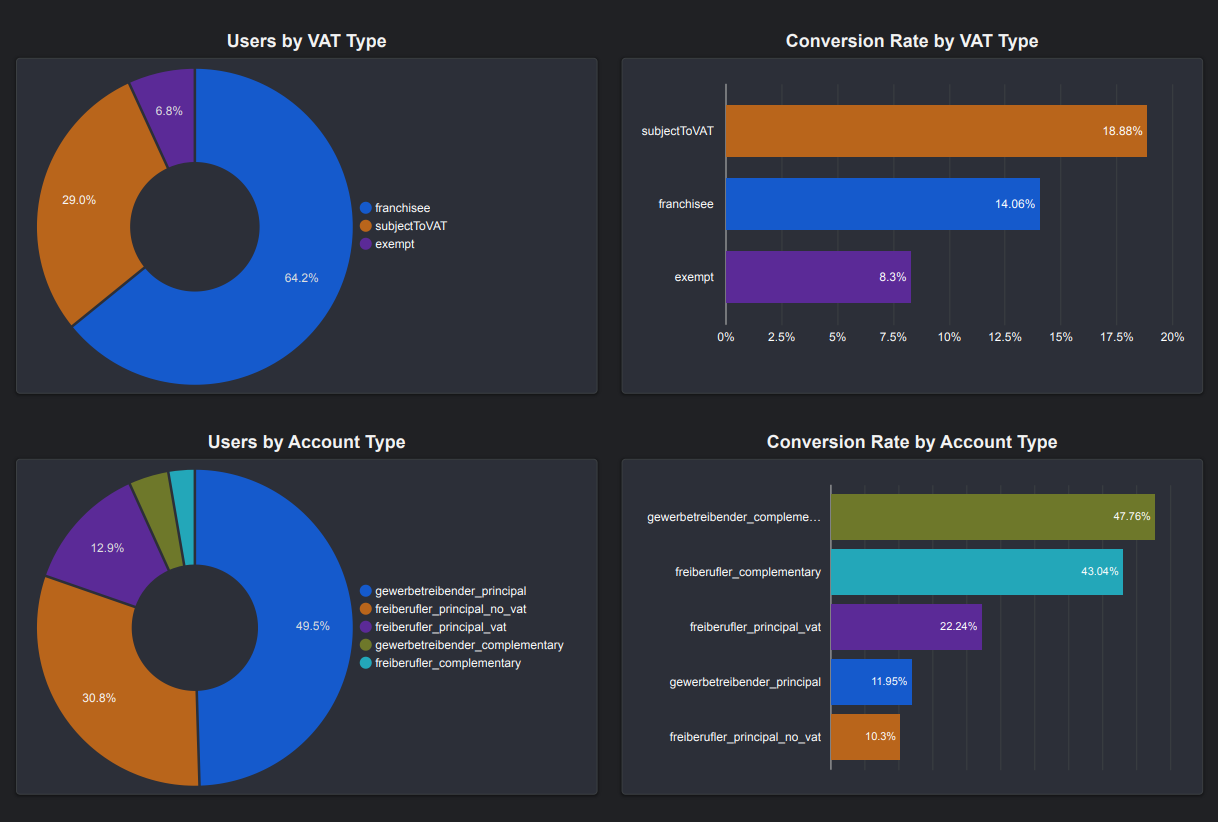
- The majority of users fall under franchise, which are small businesses that are exempt from VAT.
- Users under subjectToVAT show higher conversion rates, suggesting that businesses actively involved in VAT processes find the app’s features more useful and valuable.
e. Account Type Segmentation
- Most users are freelancers or self-employed individuals who do not pay VAT.
- Complementary status users, those with a primary employment and a freelancing side gig, have the greatest conversion rates.
✅ Recommendations
- Region-specific Marketing:
- High-performing regions (e.g., Berlin, NRW): Develop and launch tailored campaigns to take full advantage of the strong performance.
- Under-tapped regions (e.g., Hamburg): Experiment with customized messaging and highly targeted marketing efforts. Our goal is to discover and capitalize on potential user growth in these areas.
- Profession-based optimization:
- High-converting professions: Strategically invest our marketing budget to target these groups with personalized campaigns. These campaigns will directly address their unique needs and pain points.
- High-volume professions (e.g., Artists & Content Creators): For these large groups, we’ll implement a nurturing strategy. This involves identifying conversion blockers, as well as running targeted A/B tests with profession-specific messaging and landing pages.
-
Targeting VAT-registered businesses: Develop and deploy marketing messages that directly address the needs of subjectToVAT users. We’ll highlight features like simplified VAT invoicing, comprehensive reporting, and efficient management.
-
Engaging dual-income users: Prioritize marketing efforts towards these users by showcasing how our app simplifies the complexities of managing multiple income streams.
-
Re-engagement of active but unsubscribed users: Implement segmented re-engagement campaigns for users who are active (e.g., bank connections, feature usage) but haven’t yet subscribed to a paid plan.
- Deepen user understanding:
- Qualitative feedback: Actively collect and analyze user feedback. This will help us inform user experience (UX) improvements and refine our marketing messages.
- Comprehensive data analysis: Conduct deeper segmentation analysis across profession, VAT type, region, and account status to uncover more opportunities for highly targeted strategies.
📌 Final Takeaways
This case study demonstrated how marketing performance and behavioral analytics integration can improve user acquisition and retention. By tracking user journeys, analyzing feature usage, and measuring campaign return on investment (ROI), we’ve built a solid framework for optimizing our app’s growth. Using interactive dashboards and a structured analysis, we uncovered several key insights:
- Engaging features drive conversions: Users who interact with our advanced financial tools or the AI Assistant show significantly higher conversion rates. This suggests a strong intent and deeper engagement with our app.
- The onboarding experience is important: The initial feature that users interact with has a significant impact on conversion rates. Early exposure to guided or enhanced functionality leads to more subscriptions.
- The marketing ROI varies by channel: Facebook has the best conversion rate, while TikTok is currently underperforming.
- Regional performance varies significantly: Berlin stands out as our top-performing region, leading in both conversion rate and monthly recurring revenue (MRR).
- Profession & VAT status: These factors significantly influence conversion behavior, highlighting the importance of profession-specific messaging and features for VAT-registered consumers.
- Dual-income users: Users with multiple income sources (like freelancers with a main job) have the highest conversion rates and represent a growing, valuable audience for us.
➡️ Next steps: We need to improve the first experience for new users, concentrate our marketing efforts on high-performing channels (such as Facebook in strong regions), and experience with different approaches to connect with users based on how they use the app and where they are. We’ll keep track on these metrics to ensure that we continue to grow effectively.